

Although it can be difficult to forecast the weather because it is always changing, data science can provide important insights into what will happen in the future. This essay explores the fascinating field of weather forecasting, which is one of the important data science project. This focuses on how Python-powered time series forecasting may give you the tools you need to make accurate predictions. Prepare yourself for an exciting travel as we examine the particulars of climate information, the effectiveness of algorithms, and, in the end, how you may use your data science expertise to forecast the weather.
Introduction
Forecasting the weather is making predictions about variables like humidity, wind speed, precipitation, and temperature for a given area and time frame. Numerous industries, including disaster management, transportation, and agriculture, depend on this work. meteorological forecasting models use advanced algorithms and weather information to provide precise predictions for the next few days or weeks.
The first step in weather forecasting in Python is usually to obtain a dataset that contains historical weather information for a particular place. Building forecasting models can benefit from the use of a dataset, such as the Daily weather data of New Delhi, which is made available on sites like Kaggle.
You can download the dataset from here
Analyzing Weather Data using Python
First, we can import necessary libraries. We used google colab platform to analyze.
import pandas as pd
import numpy as np
import matplotlib.pyplot as plt
import seaborn as sns
import plotly.express as px- Pandas : Pandas is a powerful library for data manipulation and analysis in Python.
- NumPy : NumPy is a fundamental package for scientific computing in Python. It offers support for large, multi-dimensional arrays and a wide range of mathematical functions.
- Matplotlib: Matplotlib is a comprehensive library for creating static, interactive, and animated visualizations in Python.
- Seaborn: Seaborn is a statistical data visualization library built on top of Matplotlib, providing a high-level interface for creating attractive and informative statistical graphics.
- Plotly Express: Plotly Express is a Python library for creating interactive visualizations using Plotly, offering a simple syntax for generating a wide range of plot types.
Upload the dataset
from google.colab import files
uploaded=files.upload()

data_train=pd.read_csv('DailyDelhiClimateTrain.csv')
data_train.head()
date meantemp humidity wind_speed meanpressure
0 2013-01-01 10.000000 84.500000 0.000000 1015.666667
1 2013-01-02 7.400000 92.000000 2.980000 1017.800000
2 2013-01-03 7.166667 87.000000 4.633333 1018.666667
3 2013-01-04 8.666667 71.333333 1.233333 1017.166667
4 2013-01-05 6.000000 86.833333 3.700000 1016.500000We can go through exploratory data analysis which is a major steps to understand useful insights.
data_train.describe()meantemp humidity wind_speed meanpressure
count 1462.000000 1462.000000 1462.000000 1462.000000
mean 25.495521 60.771702 6.802209 1011.104548
std 7.348103 16.769652 4.561602 180.231668
min 6.000000 13.428571 0.000000 -3.041667
25% 18.857143 50.375000 3.475000 1001.580357
50% 27.714286 62.625000 6.221667 1008.563492
75% 31.305804 72.218750 9.238235 1014.944901
max 38.714286 100.000000 42.220000 7679.333333Insights
Temperature
- The average mean temperature recorded is approximately 25.5°C.
- The temperature varies by around 7.35°C from the mean, indicating a moderate level of temperature fluctuation.
- The minimum temperature observed is 6°C, while the maximum is 38.71°C.
Humidity
- The average humidity level is approximately 60.77%.
- Humidity shows less variability compared to temperature, with a standard deviation of around 16.77%.
- The humidity ranges from a minimum of 13.43% to a maximum of 100%.
Wind Speed
- The average wind speed is approximately 6.80 km/h.
- Wind speed has a wider variability compared to humidity, with a standard deviation of around 4.56 km/h.
- The minimum recorded wind speed is 0 km/h, while the maximum is 42.22 km/h.
Mean Pressure
- The average mean pressure is approximately 1011.10 hPa.
- Mean pressure exhibits a considerable standard deviation of 180.23 hPa, suggesting notable fluctuations.
- There is a wide range of pressure values observed, from a minimum of -3.04 hPa to a maximum of 7679.33 hPa. The presence of negative values for pressure may indicate potential data issues or anomalies that need further investigation.
Let’s check whether there is any null values,
data_train.info()<class 'pandas.core.frame.DataFrame'>
RangeIndex: 1462 entries, 0 to 1461
Data columns (total 5 columns):
# Column Non-Null Count Dtype
--- ------ -------------- -----
0 date 1462 non-null object
1 meantemp 1462 non-null float64
2 humidity 1462 non-null float64
3 wind_speed 1462 non-null float64
4 meanpressure 1462 non-null float64
dtypes: float64(4), object(1)
memory usage: 57.2+ KBWe can see that there is no null value seen in the data. The date column in this dataset is not having a datetime data type. We will change it when required.
Data Visualization
Time series plot of Temperature with respect to time is given below.
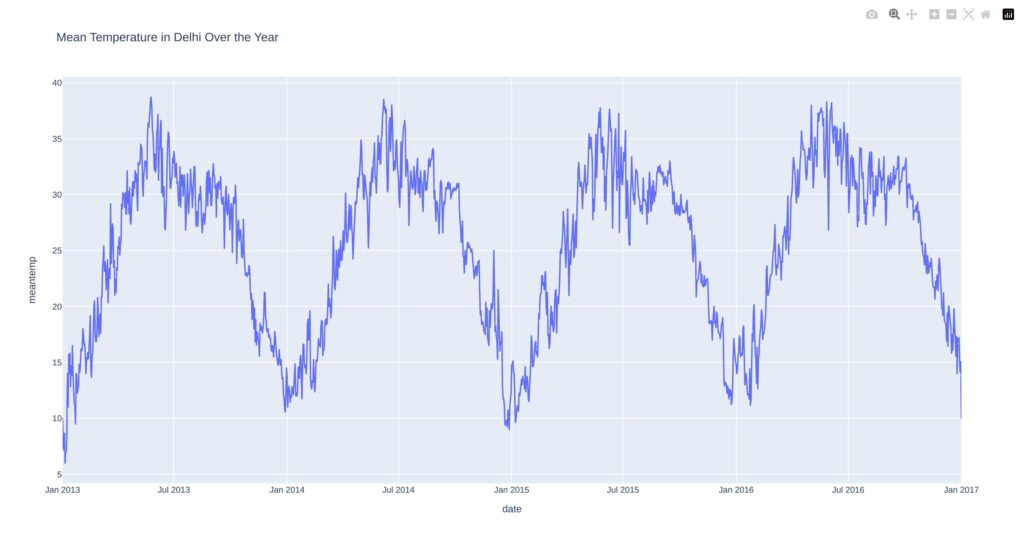
So, temperature variable is not stationary. Mean temperature is high during May and June of each year and low during December and January. We can identify that there is seasonality. Similarly we can plot time series plot of humidity and wind speed.
figure= px.line(data_train, x='date', y='humidity', title='Mean Humidity in Delhi the Years')
figure.show()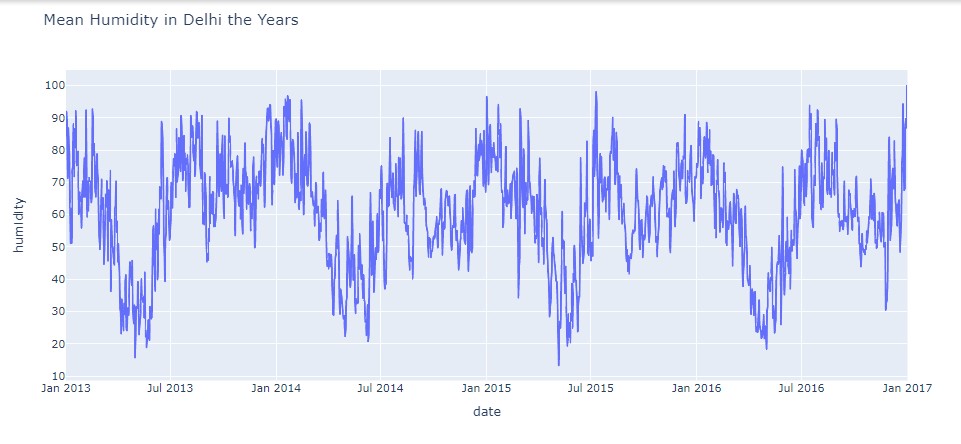
figure=px.line(data_train, x='date', y='wind_speed', title='Wind speed in Delhi over the years')
figure.show()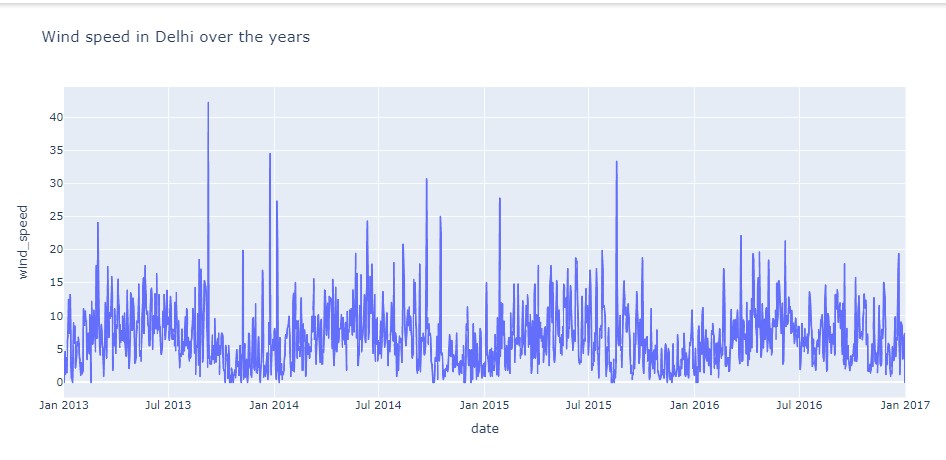
Humidity shows seasonality. It shows low value during April, May and June. Humidity shows high value on January month.
Up to 2015, the monsoon months (August and September) and the outgoing monsoon months of December and January had higher wind speeds. There were no variations in wind speed during the monsoon season after 2015.
To find the relationship between the temperature and humidity, we can plot Scatterplot.
figure=px.scatter(data_frame=data_train,
                  x='humidity',y='meantemp', size='meantemp',
                  trendline= 'ols',
                  title = 'Relationship between temperature and humidity')
figure.show()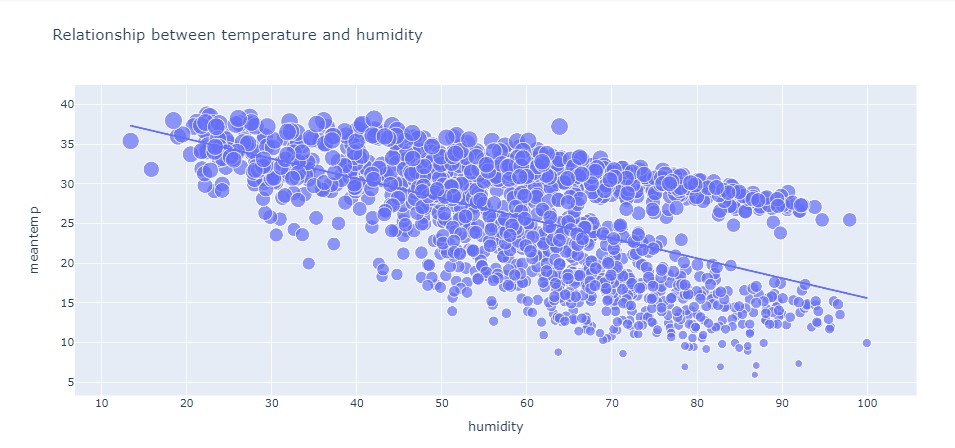
Humidity and temperature are negatively correlated. Higher the temperature, lower the humidity. Lower the temperature, higher the humidity.
For checking whether the variables are normally distributed on not, I plotted histogram of Temperature as well as Humidity.
plt.hist(data_train['meantemp'], bins=10, density=True, alpha=0.6, color='g')

plt.hist(data_train['humidity'], bins=10, density=True, alpha=0.6, color='g')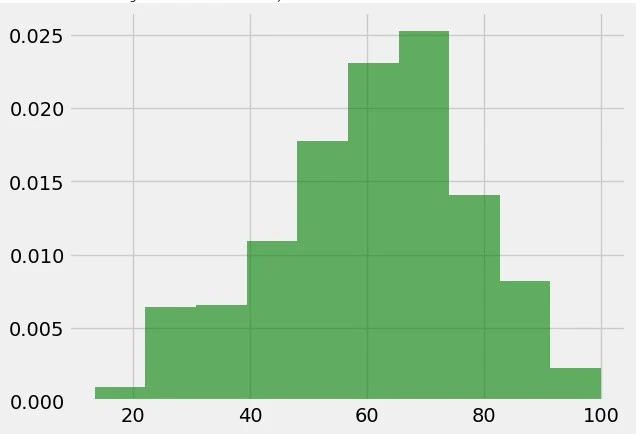
The temperature is negatively skewed and Humidity is normally distributed.
The correlation coefficient between the variable can be obtained by,
data_train.corr()
meantemp	humidity	wind_speed	meanpressure
meantemp	1.000000	-0.571951	0.306468	-0.038818
humidity	-0.571951	1.000000	-0.373972	0.001734
wind_speed	0.306468	-0.373972	1.000000	-0.020670
meanpressure	-0.038818	0.001734	-0.020670	1.000000
Analyzing Temperature Change
Let’s now examine how Delhi’s temperature has changed throughout time. I shall first change the date column’s data type to datetime for this task. After that, I’ll add two more columns to the dataset with values for the year and month.
To extract year and month data from the date column, use these steps to modify the data type:
data_train['date']=pd.to_datetime(data_train['date'],format='%Y-%m-%d')
data_train['year']=data_train['date'].dt.year
data_train['month']=data_train['date'].dt.month
data_train.head()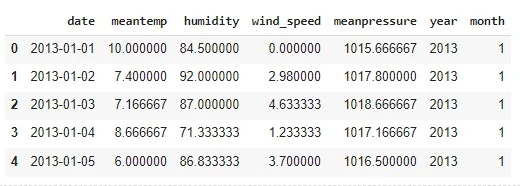
Let’s now study how Delhi’s temperature has changed over time:
plt.style.use('fivethirtyeight')
plt.figure(figsize=(15,10))
plt.title('Temperature change in Delhi over time')
sns.lineplot(data=data_train,x='month', y='meantemp', hue='year')
plt.show()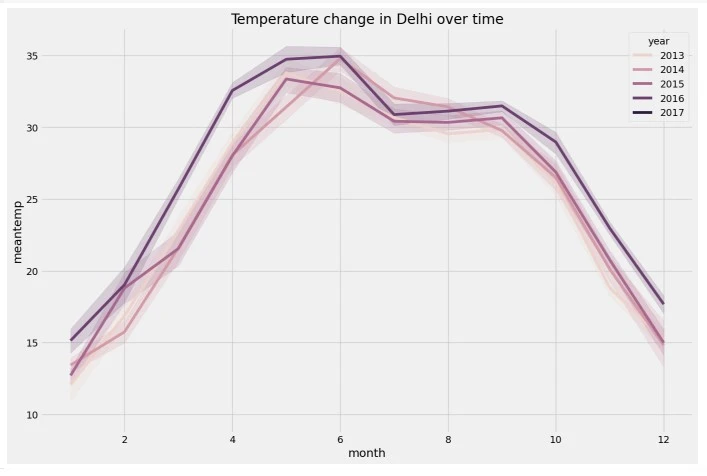
Considering the fact that 2017 was not the hottest summer on record, Delhi’s average annual temperature is rising.
Forecasting Weather
Let’s now turn our attention to the challenge of predicting the weather. I’ll be using the Facebook Prophet model for this project, which is one of the best methods for time series forecasting. With its strong skills in collecting complicated temporal patterns, the Facebook Prophet model is capable of forecasting changes in atmospheric pressure, temperature trends, and wind patterns. Don’t worry if you haven’t got a chance to utilise this model’s capabilities yet; installing it on your computer is a simple procedure.
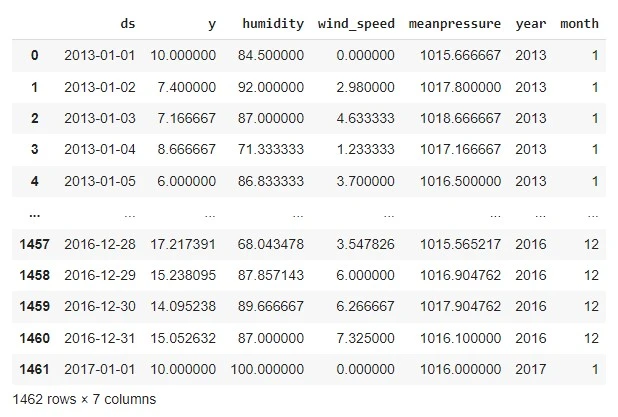
pip install prophetTo convert your data into the format accepted by the Prophet model, where time data is named as “ds” and labels are named as “y”, you can use the following Python code:
forecast_data=data_train.rename(columns={'date':'ds','meantemp':'y'})
forecast_data
Now below is how we can use the Facebook prophet model for weather forecasting using Python:
Import necessary models first, Then do remaining forecasting.
from prophet import Prophet
from prophet.plot import plot_plotly, plot_components_plotly
model = Prophet()
model.fit(forecast_data)
forecasts = model.make_future_dataframe(periods=730)
predictions = model.predict(forecasts)
plot_plotly(model, predictions)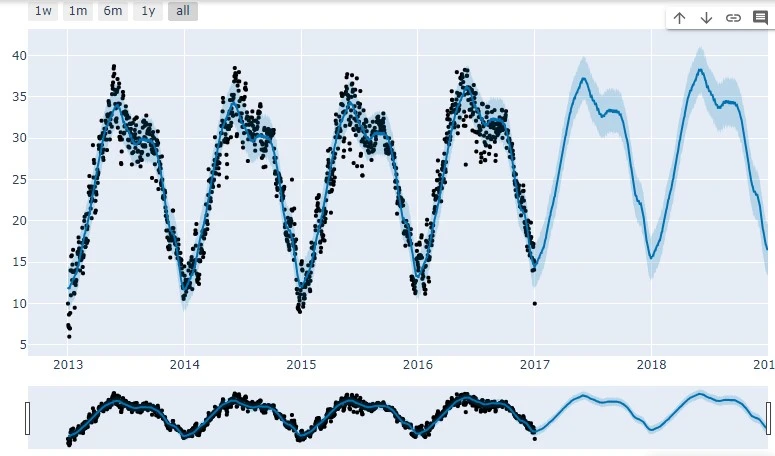
So this is how you can analyze and forecast the weather using Python.
Summary
Weather forecasting is the process of estimating the weather for a given area and time period, including temperature, humidity, wind speed, and atmospheric pressure. Forecasters are able to predict weather patterns and changes over the next several days by using advanced algorithms and weather data. This post covered weather analysis and forecasting with Python, showing how to utilize complex models like the Facebook Prophet for forecasting, visualize trends, and analyze historical weather data. Please feel free to leave a comment below with your ideas and any questions if you think this post was beneficial. Your comments and questions are always appreciated.