

A life table, sometimes referred to as a mortality table or an actuarial table, is a vital demography tool that’s used to compute life expectancy at different ages within a given population and analyse patterns of mortality. A complete life table provides detailed information about mortality patterns for every single year of age within a population. It typically includes the following columns:
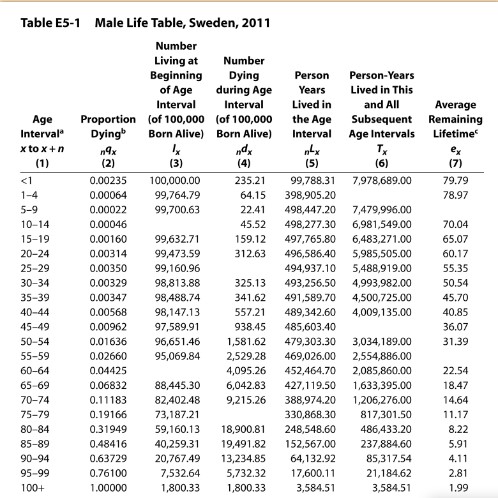
| Age (x) | Represents the exact age at the beginning of the age interval. |
|---|---|
| Number surviving (lx) | The number of individuals from the initial cohort (usually set at 100,000) who are still alive at the beginning of the age interval. |
| Number dying (dx) | The number of individuals from the initial cohort who die during the age interval. |
| Probability of death (qx) | The probability that an individual at age x will die before reaching age x+1. It is calculated as dx / lx. |
| Person-years lived (Lx) | Number of person years lived by lx persons during the age interval x to (x+1) |
| Life expectancy (ex) | The average number of additional years an individual at age x can expect to live, if current mortality patterns remain constant. |
| Remaining life expectancy (Tx) | The total number of years that the lx individuals can expect to live beyond age x |
Calculation of each columns – Life Table
Number surviving (lx)
- For the first age (x = 0): We set lx to a fixed value, often 100,000, representing the initial cohort size.
- lx is non increasing function of x & starts itself with l0
l0 is called ‘Radix of the life table’, ‘Size of the birth cohort’, ‘Population of the life table’, ‘Survivorship of the life table’ or ‘Initial birth of the life table’
Number dying (dx)
or
Probability of death (qx)
or
where px is the probability of person living in the age interval (x,x+1)
- The study of qx column shows that it has the shape of ‘BATH TUB’
- qx first decreases and then increases.
- qx tells about the mortality at which stage of life, the mortality is high and at which stage it is low.
Person-years lived (Lx)
- This is an approximation assuming that deaths are evenly distributed across the age interval.
- It is important to note that this assumption under the linear relationship is not valid for age interval (0,1)
- In this case we use the following two approximations
and
From L3 onwards, we use equal weights of 0.5.
Life expectancy (ex)
This is the average number of additional years an individual at age x can expect to live. It measures the average number of years a person of given age x can be expected to live under the prevailing mortality conditions.
Remaining life expectancy (Tx)
From x to the end of life. This is the total number of years that the lx individuals can expect to live beyond age x.
Life Table birth rate and Death rate
In a life table with stationary population, the birth and death are equal to the inverse of the expectation of life.
Stationary and Stable population
A stationary population is a theoretical population that maintains a constant size over time. This means the number of births is equal to the number of deaths in each period, resulting in zero population growth.
A stable population is a more general concept that encompasses a broader range of populations. It refers to a population with an invariable age structure and a fixed rate of natural increase.
Let’s practice